Note from Tom: A couple of weeks ago, I eluded in the post entitled “Looking at Both Sides of the Equation” that Nitrogen Index tool was the only nitrogen tools that provided information on the amount of nitrogen that is lost for a crop system by leaching, surface transport, and denitrification. Shortly after posting this article, I received an email from Dr. Harold van Es of Cornell University correcting this statement. The following is a guest blog by Dr. van Es.
Guest post written by Dr. Harold M. van Es, Cornell University
These days, there is so much interest in finding the balance between production vs. environmental needs related to nitrogen. EPA is demanding nutrient reduction strategies from states within the Mississippi River Basin to address the hypoxia issue. And Walmart identified nitrogen fertilizer as having, by far, the largest greenhouse gas impact in its supply chain, and is working with its suppliers to reduce its “carbon” footprint. In all cases the N reduction goals are very ambitious, and we need to go well beyond business-as-usual to make an impact. On top of that, we will see further change driven by lower profit margins with the depressed grain prices. Interesting times, for sure!
A number of approaches are being promoted to reduce N losses: 4Rs, in-field mitigation (cover crops, etc.), and landscape buffers (wetlands, etc.). Our Adapt-N tool, a cloud-based simulation model that uses high-resolution weather data, is a quintessential 4R instrument. It helps find the right N rate based on soil, crop, and weather information, as well as the time of application, placement, and fertilizer/manure formulation (the other 3Rs).
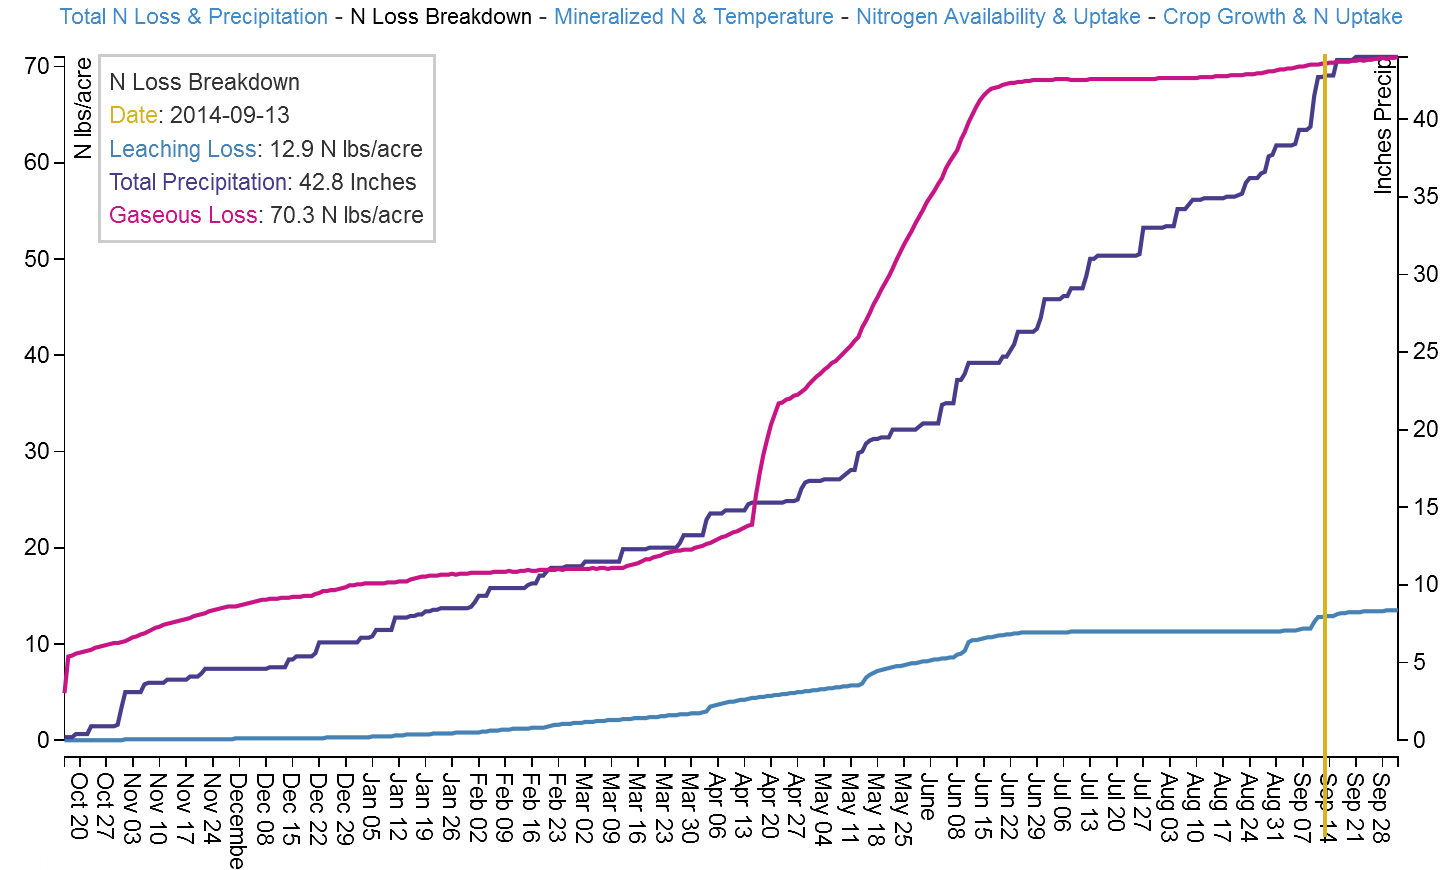
It also addresses Tom’s point about the need to quantify environmental impacts. We built in features that provide tabular and graphical information on leaching, denitrification, and – soon – N2O losses (see graph). We found that such transparency is valuable to the users and also helps drive positive management changes. If Adapt-N says you lost 100 lbs of N from a 180 lbs pre-plant application during a wet spring, would you not start thinking about sidedressing?
We just published the results of 104 on-farm strip trials in 2011, 2012, and 2013 in Iowa and New York on our What’s Cropping Up blog (http://blogs.cornell.edu/whatscroppingup/2014/10/02/adapt-n-boosts-profits-and-cuts-n-losses-in-three-years-of-on-farm-trials-in-new-york-and-iowa). We are pleased to have proven win-win opportunities: Adapt-N resulted in average profit gains of over $30/ac, while reducing N inputs on average by 44 lbs/ac with quantifiable environmental benefits. The key is NOT to cut N inputs across the board, but to match N applications with actual crop demand for a particular location and growing season. We also have very encouraging results from other states, which we will present soon. So, technology can help lead the way!
